The amplification product of the autosomic STRs obtained from Exhibit 165B was subjected to capillary electrophoresis by means of the ABIPRISM 3130 Genetic Analyzer instrument, using the “Gene Mapper” analysis software.
Since the record does not suggest that any modification was made to the electrophoresis protocol, we assume that the running conditions were the standard ones indicated by the kit.
We report here the plot relative to the electrophoretic run of the amplified DNA from sample 165B dated “Jun 10, 2008“, appended to the RTIGF.
Since the electrophoretic plot reveals that more than two peaks are visible at several markers, the Technical Consultant correctly hypothesized that this was “a genetic profile (Table 165-I) deriving from a mixture of biological substances belonging to at least two individuals, at least one of male sex” (RTIGF, p.202).
The Technical Consultant then concludes that “Comparison of the genotype deriving from trace B of Exhibit 165 with those belonging to Raffaele SOLLECITO and Meredith Susanna Cara KERCHER (comparisons performed respectively with the genetic profile reported on p.63 Table 30-I, referable to Exhibit 30 and with the genetic profile reported on p.50, referable to Exhibit 21, table 21) yielded a result of compatibility, i.e. the genetic profile shown in Table 165-I is compatible with the hypothesis of mixture of biological substances (presumably flaking cells) belonging to Raffaele SOLLECITO and to Meredith Susanna Cara KERCHER“.
It should be noted that the interpretation of the alleles, as recorded in the technical report, was contested by Prof. Pascali in the course of the G.U.P. [preliminary] hearing, on 10-04-2008.
The dispute concerned the interpretation of certain peaks held to be alleles by Prof. Pascali and stutter by Dr. Stefanoni.
In particular, on p.100 of the transcript of the interrogation, we read as follows:
Question (Prof. Pascali): “There a lot of peaks with neither a name nor a number of R.S.U.[=R.F.U.?]; can you give us the lot files so we can interpret them?”
Answer (Dr. Stefanoni) (pp.100-101) “So as you correctly say, the height, or rather the indication, to put it better, is, as you rightly point out, not recorded for certain peaks appearing in this electropherogram; it’s obviously true that we can see that they aren’t there, but this is for a simple reason, because since I interpreted this mix, I obviously took it as my responsibility to regard these alleles, so to speak, or these peaks, as insignificant, because from my point of view they’re stutter, they’re artifacts that are absolutely described and measured, quantified both in the literature and in the kit that I use.”
The Judge asks (p.101) “So explain to us what you mean by stutter.”
The Technical Consultant (p.101) states: “…stutter are extra peaks, so to speak, which show up with a certain frequency according to the genetic point that we go to analyze at the moment in which the PCR has run…”
She later (p. 102) explains “(omissis) In making this error it obviously creates artifacts which, however, have a precise characteristic: they are above a certain number of units, which in this case is always four because the units that repeat in these peaks are four; it’s always of a smaller unit than the main peak, so we know by looking at the main peak and by looking at the proportion that this extra peak has with respect to the main peak, we can say that this little peak, let’s say, is an incorrect addition due to this inherent error[-producing] mechanism of the TAC“.
Judge: “So you identify it based on characteristics that you read off a diagram, basically?“.
Stefanoni: “Yes, exactly, from the height which they shouldn’t be above according to the international standards that are actually reported in this work that the Professor was citing, which however are recommendations for correct interpretation, so they’re guidelines, for the height and the percentage that this hieght has with respect to the main peak, this height, this percentage should never be above fifteen percent because otherwise there’s a risk of mistakenly attributing a peak of this type to stutter“.
We agree with Dr. Stefanoni regarding the definition of stutter and we reiterate that stutter are non-specific [aspecifici] peaks due to the production, during the PCR, of amplification product that is shorter than one repetition with respect to the corresponding allele.
Briefly, the mechanism of stutter formation is as follows: during the replication, the two strands of DNA appear and the polymerasis elongates the one in position 5’→ 3′. It can sometimes happen that in one of the two strands, a repetition remains separated [spaiata] and the two strands become staggered. In most cases, the separated repetition lies on the strand that acts as a mold [stampo], so that the newly synthesized strand will present one fewer repetition.
The presence of stutter influences the interpretation of genetic profiles, especially in cases where two or more individuals may have contributed to the profile of the trace under examination (mixed trace).
Stutters in fact have the same length as a true allele, and hence it can be difficult to establish whether a peak is actually an allele deriving from a minor contributor, or a stutter.
The behavior of stutters has been amply studied for the STR loci contained in commercial kits. Di- and tri-nucleotide repetitions have a greater tendency to form stutter compared to tetra- and penta- nucleotide repetitions, and this is one of the reasons why the STRs used in forensics have tetra- and penta-nucleotide repetitions.
Furthermore, all loci display a tendency of increased stutter formation for alleles of greater molecular weight.
Stutters are identified by comparing the height of the peak with that of the corresponding allele. This ratio [rapporto], for the STR loci used in forensic investigations, is generally less than 15%.
Since, as correctly stated by Dr. Stefanoni, the presence of several peaks at different markers indicates the presence of a mixed profile, and the Technical Consultant herself, regarding the evaluation of stutter, confirms that there exist international standards “which however are recommendations for correct interpretation, so they’re guidelines“, it is necessary to recall what the definition and interpretation of stutter in a mixture reported in the Recommendations of the International Society of Forensic Genetics (“DNA Commission of the International Society of Forensic Genetics: recommendations on the interpretation of mixtures”; P. Gill et al., For Sci Int., 90-101, 2006) referred to by the Technical Consultant is.
“6. Treatment of stutter
The characteristics of stutter bands (one repetition fewer compared to the neighboring [vicino] allele) were measured in relation to the measurement of the associated neighboring allele.
The area or height of the stutter peaks is measured as a proportion (
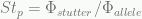
In general, 
We now report the electropherogram, dated Sep 25, 2009 10:10 AM, relating to the interpretation of the stutters performed by Dr. Stefanoni, sent to us by her via CD-ROM, on April 29, 2011.
In order to determine whether the interpretation of the stutters in the electropherogram attached to the RTIGF was performed, as the Technical Consultant claimed, according to the “international standards” and according to the recommendations of the ISFG, we examined the electrophoretic graph, sent to us by Dr. Stefanoni via e-mail, on May 10, 2011, with the indications relative to the heights and areas of all the peaks present in the attached graph.
We note that no date of execution of the electrophoretic run is recorded in the graph sent to us on May 10, 2011, but from a comparison between this and the electropherogram dated Sep 25,2009 10:10 AM, where the stutters are indicated, we observe that the peaks present the same heights, so we conclude that the graph sent to us on May 10, 2011 refers to the graph dated Sep 25,2009 10:10 AM. However, differences in the heights of the peaks expressed in RFU emerge from a comparison of these electropherograms with the electropherogram attached to the RTIGF (dated June 10,2008 12:58 PM) (cf. electropherograms) in that in the graph attached to the RTIGF, the peaks present RFU [levels] above 1200 while in the other electropherograms (electropherogram of May 10, 2011, electropherogram dated Sep 25, 2009 10:10 AM) the peaks present RFU [levels] clearly [nettamente] below 1200.
We report the graph sent to us on May 10, 2011 below:
In light of the numerical data relative to the heights of the peaks present in the electropherogram, and having explained the criteria for defining stutter, we can make the following observations concerning the interpretation of the peaks performed by the Technical Consultant.
Below, we analyze certain DNA markers, already subject to dispute, reporting for each of them the numerical values relative to the peak heights; the heights will be used to determine whether the peaks graphically present should be interpreted as alleles or stutter, according to the Recommendations of the International Society of Forensic Genetics (ISFG).
[figure p. 121]
[figure p. 122]
We can assert that, relative to markers D8S1179, D21S11, D19S433, [and] D5S818, there was an erroneous interpretation of the peaks present in the electrophoretic plot, in that peaks with height over 50 RFU (D19S433: peak 14 ↑ 54) or which exceeded the threshold of 15% of the major allele (D8S1179: Peak 14 ↑ 53 (39.09% of allele 15); D21S11: Peak 29 ↑ 94 (15.58% of allele 30) or were not in stutter position (D5S818) and which, therefore, should have been considered alleles.
Regarding the evaluation of stutter we reiterate that the Technical Consultant, despite having affirmed that there are “…recommendations for correct interpretation, so they’re guidelines” (GUP 10-04-2008, p.102), did not, in practice, correctly apply the recommendations made explicit in the ISFG guidelines.
In fact, in paragraph 6 “Treatment of stutter” (“DNA Commission of the International Society of Forensic Genetics: recommendations on the interpretation of mixtures”. For Sci Int, 2006) the following recommendation is reported:
“Recommendation 6: If the crime profile is a major/minor mixture, where minor alleles are the same size (height or area) as stutter of major alleles, then the stutters and minor alleles are indistinguishable. Under these circumstances, alleles in stutter position that do not support 
This recommendation was entirely disregarded by the Technical Consultant, where she states “So as you correctly say, the height, or rather the indication, to put it better, is, as you rightly point out, not recorded for certain peaks appearing in this electropherogram; it’s obviously true that we can see that they aren’t there, but this is for a simple reason, because since I interpreted this mix, I obviously took it as my responsibility to regard these alleles, so to speak, or these peaks, as insignificant, because from my point of view they’re stutter, they’re artifacts that are absolutely described and measured, quantified both in the literature and in the kit that I use.” (GUP 10-04-08, p. 100-101).
Applying Recommendation No. 6 of the ISFG (that is, where in a mixture the alleles of the minor contributor are of the same height or area as the stutters and thus the alleles and stutters are not distinguishable, the alleles in stutter position that do not support the prosecution theory should be included in the assessment_) to the present case, and taking into account the analogous consideration regarding the possible occurrence of allelic drop-out (ISFG, point no.7), it follows that all the peaks present in the individual DNA markers, as reported in the attached electropherogram, should be considered alleles.
Thus, the interpretation of the electropherogram is rather more complex and involved [articolata] than what is reported in the RTIGF. Indeed, even if one were to arbitrarily limit the application of Recommendation 6 to peaks in stutter position above the threshold of 50 RFU, this still reveals a profile deriving from the mixture of several individuals consisting of a major contributor and several minor contributors, as summarized in the table below:

![[graph p. 112]](https://knoxdnareport.files.wordpress.com/2011/07/cvgraphp112.png)
![[graph p. 116]](https://knoxdnareport.files.wordpress.com/2011/07/cvgraphp116.png)
![[graph p. 117]](https://knoxdnareport.files.wordpress.com/2011/07/cvgraphp117.png)
![[graph p. 120]](https://knoxdnareport.files.wordpress.com/2011/07/cvgraphp120.png)
![[figure p. 121]](https://knoxdnareport.files.wordpress.com/2011/07/cvfigurep121.png)
![[figure p. 122]](https://knoxdnareport.files.wordpress.com/2011/07/cvfigurep122.png)
![[graph p.124]](https://knoxdnareport.files.wordpress.com/2011/07/cvgraphp124.png)
![[graph p. 125]](https://knoxdnareport.files.wordpress.com/2011/07/cvgraphp125.png)
![[table p. 126]](https://knoxdnareport.files.wordpress.com/2011/07/cvtablep126.png)
Leave a comment