The amplification product obtained from samples A and B was subjected to capillary electrophoresis using the ABIPRISM 3130 Genetic Analyzer instrument, and the analysis software “Gene Mapper”.
Since it does not appear from the documents that any modification was made to the electrophoresis protocol, it is inferred that the run conditions were the standard ones indicated by the kit.
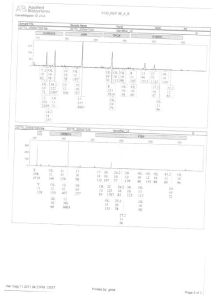
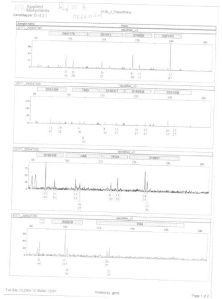
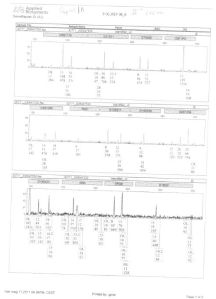
The electropherogram relating to the electrophoretic run of the amplified DNA from sample A (knife handle), attached to the RTIGF, is shown below:
On 29 April 2011, the electropherogram relating to the electrophoretic run of the amplified DNA from sample A was sent to us on CD-rom, on which the heights of the allele peaks are indicated:
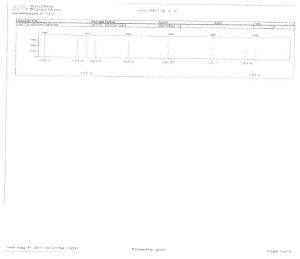
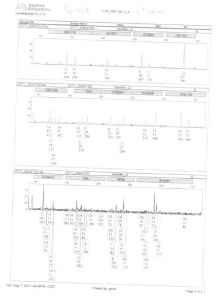
And on 11 May 2011, the electropherogram relating to the electrophoretic run of the amplified DNA from sample A was sent to us via e-mail, on which the heights and areas of the peaks are indicated:
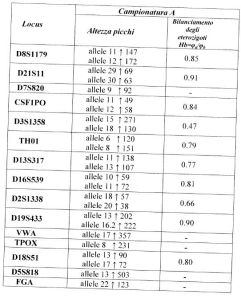
With respect to the electrophoretic run of the amplified DNA from sample A, we note from all the electropherograms that: a) peaks which exceed the 50 RFU threshold are present (it is emphasized that 50 RFU is the threshold recommended by the kit manual, and it is not advised to go below this point); b) the alleles are balanced in that the ratio between the peaks is >0.60 (Gill. P et al., 2006), in accordance with the presumed quantity of DNA used for the reaction (0.8 ng).
In the following table, the alleles with the associated peak heights and the calculations of heterozygous balance are shown:
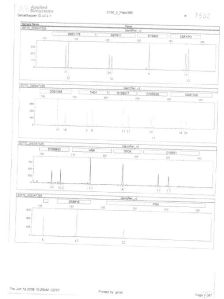
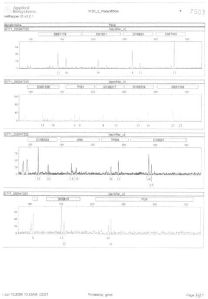
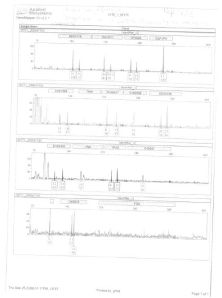
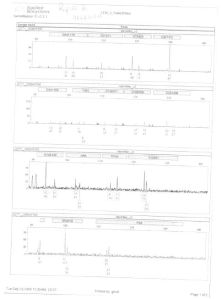
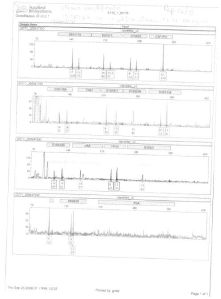
With regard to sample B (knife blade), the electropherogram relating to the electrophoretic run of the amplified DNA from the aforementioned sample, attached to the RTIGF, is shown below:
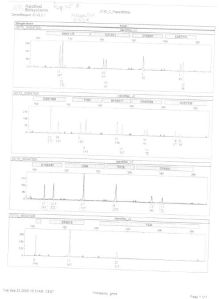
On 29 April, the electropherograms relating to the two electrophoretic runs of the amplified DNA from sample B were sent to us on CD-ROM, on which the allele peak heights are indicated (electropherograms dated respectively Run 1: Sept. 23 2008, 10:35 AM; Run 2: Sept. 25 2008, 01:17 PM).
ELECTROPHORETIC RUN 1 (Sept. 23 2008, 10:35 AM):
ELECTROPHORETIC RUN 2 (Sept. 25 2008, 01:17 PM):
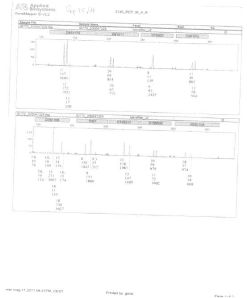
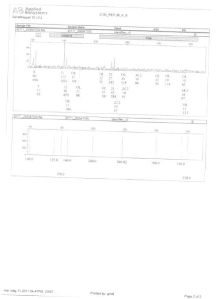
On 11 May 2011, the electropherograms relating to the above runs were sent to us via e-mail, but with the peak heights and areas indicated; these are shown below.
ELECTROPHORETIC RUN 1 (May 11 2011, 04:48 PM):
ELECTROPHORETIC RUN 2 (May 11 2011, 04:36 PM)
Since the electrophoretic graphs, produced both in CD-ROM and e-mail format, do not differ from each other in any significant way (c.f. peak heights), for ease of exposition our comments here relate to the electrophoretic runs dated Sept. 23 2008, 10:35 AM and Sept. 25 2008, 01:17 PM, but are equally intended to apply to the electropherograms dated May 11 2011, 04:48 PM and May 11 2011, 04:36 PM.
From an examination of Electrophoretic Run 1, dated “Sept. 23 2008, 10:35 AM, it must be noted that: 1) this graph shows peaks which are clearly below the 50 RFU threshold (it is emphasized that 50 RFU is the threshold recommended by the kit manual, and it is not advised to go below this point); b) the alleles are imbalanced in that the ratio between many peaks is <0.60 (Gill P. et al., 2006).
ELECTROPHORETIC RUN 1 (Sept. 23 2008, 10:35 AM).
In the following table, the alleles with the associated peak heights and the calculations of heterozygous balance are shown:
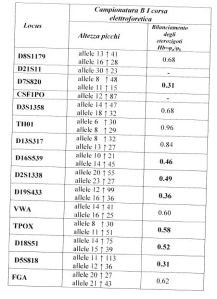
From an examination of electrophoretic run 2, dated Sept. 25 2008, 01:17 PM, the following are noted: the loss of alleles for some markers (TH01, D16S539, vWA, D18S51, FGA); a peak is present for one marker which is not present in run 1 (D21S11: presence of allele 33.2); and there is an inversion of peak heights for other markers (D3S1358, D2S1338, D19S433, D5S818).
Regarding the assessment of the peak heights in sample B, the Technical Consultant was specifically asked (GUP, page 20) “When in your experience do you define an RFU value as rather low?” and answered: “below 50, I start to take greater care in the assessment”. Responding to the explanations requested by the GUP (page 21) about the sample with identification code 47330 (sample B, Exhibit 36) – “Perfect! What do we have here?” – the Technical Consultant replies: “Well, here we have a genetic profile which certainly has a lower R.S.U. [RFU?] intensity than the previous one”. Q: “In the order of…?” A: “Let’s say we’re in the order of, let me see, again the same genetic point that I defined earlier, at which we see a 41 and a 28”. Q: Therefore for you there would already be a bit of a risk, as we said before a little bit low?” A: “Yes, yes, yes”.
Again, responding to a question from Dr. Biondo (transcript of the GUP hearing, page 72): “There was another aspect for which, when one does a DNA analysis where the peaks, the heights reported in R.S.U. are low, you said there was a risk. Can you explain this risk?” The Technical Consultant replies: “Well, there’s a risk in the sense that in practice when I evaluate a genetic profile which has rather low peak heights, roughly below 50 RFU, 50, 60, I risk performing an operation which is something, so to speak, that no forensic geneticist would wish to do, and that is to poorly interpret that profile…that is, in the sense that I might make a mistake in the assessment, assess a peak in an erroneous manner because perhaps it is too low, and therefore perhaps run the risk of excluding a person who might be the victim from the framework of the investigations…”
The following question is reported on pages 21-22 of the GUP questioning: “…the testing of a trace of this sort should be repeated several times to be considered reliable?” The Technical Consultant replies: “In theory yes”. To the question, “How many times did you do it?” she responds: “In this case only once”. Q: “Just once, and therefore in theory why ought it to be considered more reliable if it is done several times?” A: “Because reproducibility of the result is, let’s say, a good standard in any scientific experiment quite apart from forensic genetics, obviously to be considered valid a result must be repeatable”.
In fact, the Technical Consultant did not repeat the amplification of the extract but performed two electrophoretic runs of the same amplification. From a comparison of the two separate runs, the existence of peak imbalance and inversion is immediately obvious, to the point where in some cases there is allele loss or the presence of an additional peak (c.f. electrophoretic graphs, runs 1-2, Sept. 2008).
In addition, it must be noted that neither the negative control – which, as previously mentioned, could have indicated the presence of possible contamination – nor the positive control, which would have allowed the effectiveness of the selected experimental conditions to be monitored, are present in the electropherograms produced.
From what has previously been stated about the analysis of the electropherograms relating to sample B, it is inferred that the quantity of extracted and amplified DNA must have been very low, falling within the definition of Low Copy Number (LCN) or Low-Template DNA (LT-DNA).
It is considered appropriate at this point to provide some clarifications about the definition of the term Low Copy Number, and to outline the experiences, suggestions and recommendations of the International Scientific Community aimed at trying to resolve some of the most frequent problems associated with biological samples of low DNA quantity (LCN).
Leave a comment